Bullish candlestick patterns are a powerful tool for traders looking to capitalize on potential stock market profits. Recent statistics show that 81% of bullish candlestick patterns signaled a successful trend reversal, indicating that traders who use these patterns can benefit from profitable opportunities.
These patterns are used to identify when a trend is reversing and provide a signal for buying. There are several patterns that traders use to make informed decisions about when to buy and sell, such as:
- Bullish Hammer
- Bullish Engulfing
- Bullish Inverted Hammer
- Bullish Morning Star
- Bullish Three White Soldiers
In this article, we explore how traders can use bullish candlestick patterns to unlock profitable opportunities in the stock market.
Key Takeaways
- Bullish candlestick patterns are a powerful tool for traders to identify trend reversals and capitalize on stock market profits.
- Combining bullish patterns with other technical indicators can strengthen the signal.
- Integrating bullish patterns with fundamental analysis helps identify profit opportunities and make well-informed trading decisions.
- 81% of bullish candlestick patterns signaled a successful trend reversal.
What Are They?
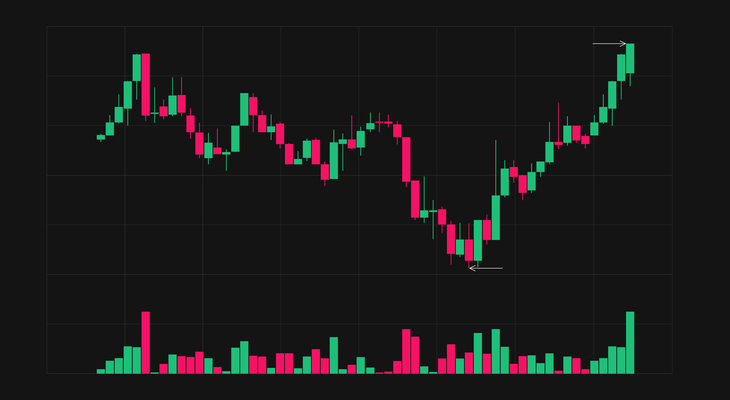
Bullish candlestick patterns are graphical representations of price action that indicate buyers are pushing prices up, potentially signaling trend reversals and buying opportunities. Identifying bullish patterns can benefit traders looking to gain an edge in the markets.
These patterns point to market sentiment shifting from bearish to bullish, and can provide clues on when and where to enter trades. Benefits of using bullish patterns include being able to identify price bottoms, spot reversals, and capitalize on short-term price movements.
Traders must also consider the risks associated with trading these patterns, as a bullish pattern may not guarantee a trend reversal. Nevertheless, traders that are knowledgeable in identifying bullish patterns can unlock profit opportunities and gain an edge in the markets.
Patterns and Signals
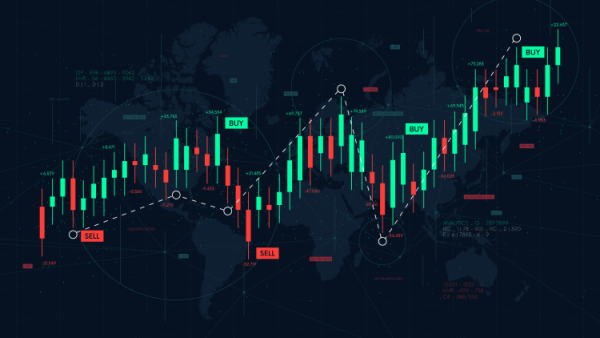
Technical analysis of the markets through the examination of certain patterns can indicate changes in market sentiment and potential buying opportunities.
Identifying bullish candlestick patterns in different timeframes can be a great way to unlock profit opportunities. These patterns are usually composed of one or more green or white candlesticks that indicate a shift in buying pressure.
For example, the bullish hammer pattern is composed of a single long green candle that signifies that buyers are pushing prices up.
Combining bullish candlestick patterns with other technical indicators can help confirm and strengthen the signal. For instance, combining a bullish hammer with a bullish moving average crossover can strengthen the signal and confirm that buyers are in control.
As always, these signals should be confirmed with subsequent price action, as they do not guarantee a trend reversal.
Using With Fundamentals
Analyzing the markets through the examination of certain figures can give traders an indication of potential market sentiment and possible entry points. Integrating bullish candlestick patterns with fundamental analysis can help traders make better trading decisions.
Identifying potential profit opportunities by combining bullish candlestick patterns with fundamental indicators can be done by:
- Examining the overall market environment to determine if the bullish pattern is supported.
- Analyzing the technical indicators to confirm the bullish pattern.
- Applying fundamental analysis to identify potential entry points.
By combining bullish candlestick patterns with fundamental analysis, traders can better identify profit opportunities and make well-informed trading decisions.
Frequently Asked Questions
What are the most reliable bullish candlestick patterns?
The most reliable bullish candlestick patterns are the Hammer, Engulfing, Inverted Hammer, Morning Star, and Three White Soldiers. These patterns indicate that buyers are pushing prices up and can signal buying opportunities and a change in market sentiment.
To confirm these patterns, traders need to look at the price action and trend lines of the security. It is important to note that these patterns do not guarantee a trend reversal and should be confirmed with subsequent price action.
Technical analysis of these patterns, combined with fundamental analysis, can help traders make smarter trading decisions.
How do I recognize a bullish candlestick pattern?
In order to recognize a bullish candlestick pattern, one must first make sure that the candlestick is green or white in color. This indicates that buyers have pushed the price up.
Next, one must analyze the pattern to determine if it fits one of the most reliable bullish candlesticks patterns, such as the Bullish Hammer, Bullish Engulfing, Bullish Inverted Hammer, Bullish Morning Star, or Bullish Three White Soldiers.
Volatility analysis and risk assessment can help identify a bullish pattern and confirm whether or not it is reliable.
It is important to remember that bullish candlestick patterns do not guarantee a trend reversal and should be confirmed with subsequent price action.
How can I use bullish candlestick patterns to inform my trading decisions?
Bullish candlestick patterns can be a useful tool for traders when formulating a trading strategy. They can provide price targets and stop losses as well as an indication of market sentiment.
When used in combination with other technical and fundamental analysis tools, traders can use bullish candlestick patterns to inform their trading decisions. For example, a trader may use a bullish hammer pattern to indicate an area of support, and then use fundamental analysis to assess the likelihood of the price moving higher.
When used in conjunction with other analysis tools, bullish candlestick patterns can be a valuable tool for traders.
Are there any risks associated with trading based on bullish candlestick patterns?
Like any short-term trading strategy, trading based on bullish candlestick patterns comes with risks. The patterns can be unreliable and should be used in combination with other strategies such as fundamental analysis and risk management.
When used correctly, bullish candlestick patterns can provide traders with an edge, but they can also be misleading and can lead to losses if used inappropriately. As with any trading strategy, traders should use risk management to ensure that their overall portfolio is protected from any unexpected losses.
By taking a disciplined approach to risk management and combining it with bullish candlestick patterns, traders can increase their chances of unlocking profit opportunities.
What other technical analysis tools should I use with bullish candlestick patterns?
When trading based on bullish candlestick patterns, traders should look to use other technical analysis tools to confirm their signals.
Support and resistance levels can be used to identify areas of potential buying and selling pressure.
Price action analysis can help identify patterns and trends in the market, and trend lines can be used to further confirm the direction of the market.
Additionally, traders should use other indicators such as moving averages, momentum oscillators, and volume to help confirm their bullish signals.
It is important to use a combination of technical analysis tools to make more informed trading decisions.
Conclusion:
Bullish candlestick patterns can provide traders with powerful signals for when to enter and exit the market. When used in conjunction with fundamental analysis, these patterns can help traders maximize their profits.
While they do not guarantee success, these patterns can give traders an edge in the market by providing insight into investor sentiment and underlying market trends. By properly utilizing these patterns, traders can unlock a world of potential profit opportunities that would have otherwise been hidden.
With the right knowledge and understanding, traders can use these patterns to successfully navigate the stock market and achieve their financial goals.