The stock market can be a wild roller coaster ride, full of highs and lows, stops and starts, and an ever-changing landscape of opportunity.
As a trader, you can find yourself on the wrong side of a trend, leading to losses and disappointment. But if you can master the art of spotting trend reversals, you can turn those losses into profits.
By learning the popular reversal patterns, calculating targets, and understanding the fundamentals and the risks, you can capitalize on these opportunities and find success.
With the right knowledge and strategy, you can become the master of your own destiny and take control of your financial future.
Key Takeaways
- Spotting trend reversals quickly is important for entering new trades.
- Reversal patterns, such as the Head and Shoulders, Double Top, and Double Bottom, can indicate the end of an existing trend.
- Reversal patterns can be used on all time intervals and markets.
- Trend following trading strategies involve drawing trend lines and using fibonacci retracement levels and pivot points.
Identifying Patterns
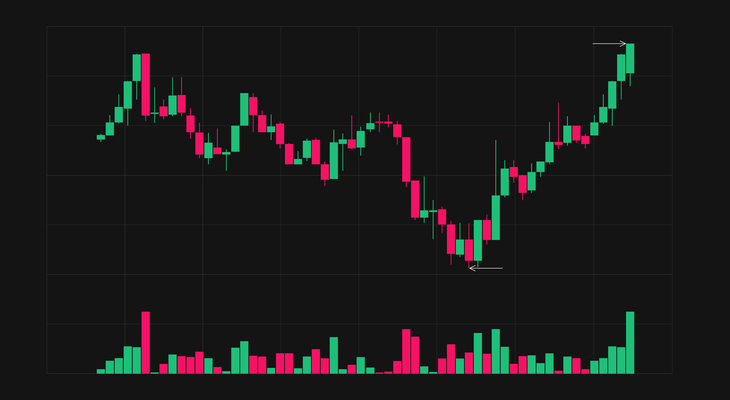
Identifying reversal patterns, such as Head and Shoulders, Double Top and Double Bottom, as well as other patterns, such as rounding bottom and rising or falling wedge, can be helpful for traders looking to spot opportunities for success in trend reversals.
By utilizing technical indicators, traders can identify entry points to enter or exit trades.
The Head and Shoulders pattern consists of a highest top (Head) and two tops on either side (Shoulders), with a line connecting the last two bottoms acting as support. A break below the neckline confirms the reversal pattern and marks the end of the uptrend.
The Double Top is another popular reversal pattern formed after two tops have formed. A modest decline between the two tops confirms the Double Top pattern.
With knowledge of these patterns, traders can gain an advantage in spotting potential trend reversals and seize opportunities for success.
Calculating Targets
Calculating targets for trend reversals requires traders to measure the top of the head to the neckline in order to achieve optimal profits.
Using Fibonacci retracement and pivot points, traders can measure the distance between the peaks and valleys of the chart, providing them with a target price level to aim for.
Measuring the peaks and valleys of a chart can also indicate when a trend is likely to reverse, allowing traders to enter or exit the market at the right time.
With this knowledge, traders can use a combination of trend lines, Fibonacci retracement levels, and pivot points to identify optimal entry and exit points, and calculate potential targets for their trades.
By doing so, traders can effectively maximize their profits while minimizing risk.
Fundamentals and Risk
Understanding the fundamentals of a market and assessing the associated risks is an important part of successful trading. Risk management should be a priority for traders looking to capitalize on trend reversals.
Fundamental analysis plays an important role in spotting trend reversals, as it allows traders to identify potential market opportunities before they occur. Through fundamental analysis, traders can better understand the current market environment and make informed decisions on when to enter and exit trades. This knowledge is essential for traders to minimize losses and maximize gains.
Risk management strategies should also be employed when trading trend reversals, as this can help traders stay in control of their positions and avoid over-leveraging. These strategies include setting stop losses and limit orders, and using proper position sizing.
By understanding the fundamentals of a market and properly managing risk, traders can increase their chances of success when trading trend reversals.
Frequently Asked Questions
What is the best time frame to spot a trend reversal?
Employing a metaphor, trend reversals can be likened to a pendulum; it swings between two extremes before coming to a rest. When it comes to trading, the best time frame to spot a trend reversal is when price action and market sentiment are at their peak.
Traders must be able to identify when a shift is taking place in order to capitalize on the opportunity. This requires careful analysis of the market conditions and the ability to recognize when the momentum has shifted.
By understanding the current market conditions and having a keen eye for changes in price action and market sentiment, traders can spot trends reversals and gain an advantage in the market.
How can I confirm the validity of a reversal pattern?
To confirm the validity of a reversal pattern, one must identify signals in the market to determine if the pattern is forming.
This includes looking for technical indicators such as trend lines, fibonacci retracement levels and pivot points.
Furthermore, it is important to manage risk when trading these patterns by setting appropriate stop losses and taking profits at certain points.
It is also important to factor in fundamental information that can affect the market and adjust positions accordingly.
By utilizing the right tools and strategies, traders can identify and capitalize on reversal patterns to achieve successful trading outcomes.
What is the best way to enter a trade after spotting a trend reversal?
Entering a trade after spotting a trend reversal is like catching lightning in a bottle – a fleeting moment where the potential for success is high.
It is important to keep risk management in mind when entering a trade, as well as setting a stop loss.
An analytical, detail-oriented approach is necessary to ensure the best chances of success.
Forward-thinking language should be used when outlining the plan for the trade, emphasizing freedom of choice and allowing the individual to make their own decisions.
What indicators should I use to detect a trend reversal?
When attempting to detect a trend reversal, traders should consider using momentum trading and trend analysis.
Momentum trading looks at the velocity of price movements to determine the direction of the trend and identify potential reversals.
Trend analysis uses a combination of support and resistance levels, chart patterns, moving averages, and other technical indicators to identify when a trend is likely to reverse.
Traders should also be aware of news and geopolitical developments that could impact market sentiment and lead to abrupt reversals.
It is essential for successful trading to remain vigilant and be able to quickly identify and act on potential reversals.
How can I protect my capital when trading trend reversals?
Trading trend reversals can be a precarious business. It is akin to playing a game of chess, where the balance between risk and reward is ever-present. To protect capital, a trader must have a risk management strategy in place, including deciding the acceptable amount to risk per trade.
Additionally, it is important to have a psychological mindset that is focused on small gains and not chasing larger returns. Having a plan in place and following it is paramount for the trader to be successful. Controlling emotions and maintaining discipline are key in order to protect capital when trading trend reversals.
Conclusion
Trend reversals provide traders with the potential for success, but it is important to identify patterns, calculate targets and understand the fundamentals and risk associated with leveraged products.
As the adage goes, ‘forewarned is forearmed’; mastering trend reversals can help traders spot opportunities and better prepare themselves for success.
By using well-defined strategies and analyzing the market conditions, traders can increase their chances of making profitable trades.