Imagine being able to make smart investment decisions without the hassle of constantly monitoring the markets or getting bogged down by emotions. That’s where TrendSpider comes in – a stock analysis software and automated technical analysis program that offers innovative and customizable products for day trading, swing trading, and investing.
With its smart algorithms, it takes emotion out of the trading equation and serves thousands of registered members. TrendSpider offers advanced charting functionalities, automated technical analysis, and customizable alerts that allow investors to make informed decisions. Whether you’re a seasoned investor or just starting out, TrendSpider’s features make trading easier and more efficient.
In this article, we will explore why TrendSpider is the ultimate trading tool for smart investors and how it can help you achieve financial freedom.
Key Takeaways
- TrendSpider is an innovative and customizable stock analysis software and automated technical analysis program for day trading, swing trading, and investing.
- TrendSpider uses smart algorithms to take emotion out of the trading equation and offers features such as raindrop charts, automated trendlines, candlestick pattern recognition, and customizable alerts.
- The platform supports U.S. stocks, forex, and crypto exchanges and offers trading education through video and blog posts.
- TrendSpider offers three subscription plans starting at $39/month and a 7-day trial, and its features include multi-timeframe analysis, options flow tracking, and a strategy backtesting framework.
Product Overview
The product overview of TrendSpider reveals that it is a stock analysis software and automated technical analysis program for day trading, swing trading, and investing. The software offers innovative and fully customizable products, using smart algorithms to take emotion out of the trading equation. TrendSpider supports U.S. stocks, forex, and crypto Exchanges, serving thousands of registered members.
Its key features include the Raindrop Chart, instant backtesting functionality, chart patterns recognition, trendline analysis, multi-timeframe analysis, and Alphatrends the VWAP. It also offers automated breakout detection and alerts, customizable watchlists with a smart alert system, Heatmap, and Options Flow feature, among others.
TrendSpider provides a user experience that is highly customizable, with a variety of tools and features that allow traders to tailor the platform to their specific needs and trading styles. The software offers a range of customization options, including customizable alerts, charts, and multi-timeframe analysis. It also enables basic chart analysis, including candlestick pattern plotting and automatic trendline application. TrendSpider’s interface is intuitive and easy to navigate, allowing users to quickly access the tools and features they need to make informed trading decisions.
Overall, TrendSpider is an excellent trading tool for smart investors, offering a wide range of features and customization options to help traders make better-informed trading decisions.
Key Features
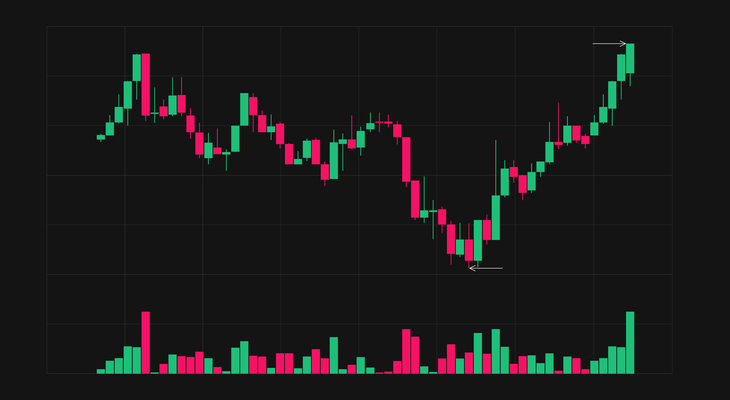
One of the innovative functionalities offered by the TrendSpider software is the Raindrop Chart, which provides traders with an alternative to classic candlestick patterns. This charting feature offers a unique way to visualize price action and volume information, allowing traders to spot trends and potential trading opportunities more easily. The Raindrop Chart can be fully customized to suit individual trading styles, with options to adjust the time frame, volume threshold, and color schemes.
Another key feature of TrendSpider is its extensive customization options for technical analysis tools. From automated trendlines to Fibonacci retracements and support and resistance levels, traders can tailor their charts to reflect their preferred trading strategies. The platform also offers customizable watchlists and alerts, allowing traders to stay on top of market movements and potential opportunities.
With these powerful features, TrendSpider offers a comprehensive suite of tools that can help traders make informed decisions and execute profitable trades.
Automated Technical Analysis
Automated Technical Analysis is a critical feature of modern trading software, allowing traders to analyze vast amounts of data and identify patterns and trends with minimal effort. In algorithmic trading, automated technical analysis can make investment decisions based on data sets and facts, removing bias and emotion from the equation. TrendSpider offers a range of automated technical analysis tools that make investment decisions more objective and emotionless.
One of the key features of automated technical analysis offered by TrendSpider is the automated detection of trendlines. The software identifies anchors for trendlines and draws them more precisely than doing it by hand. Additionally, TrendSpider’s algorithmic trading platform offers automated Fibonacci retracements, which plot retracement lines automatically, saving time. These features help traders make more informed decisions based on objective data, removing the emotional element from the investment process.
| Automated Technical Analysis Features | Benefits |
|---|---|
| Automated trendline detection | More precise than manual drawing |
| Automated Fibonacci retracements | Saves time and effort |
| Data-driven investment decisions | Removes bias and emotion from the equation |
Advanced Charting Functionalities
Advanced charting functionalities are essential for traders to make informed investment decisions based on objective data and eliminate the emotional element from the investment process. TrendSpider offers a customizable and automated charting software that provides users with advanced functionalities to support their trading strategies.
With TrendSpider, traders can apply a range of features to their charts, including candlestick pattern recognition, support and resistance lines, automated Fibonacci retracements, and real-time prices for U.S. stocks, ETFs, forex, and cryptos. The platform automatically detects anchors for trendlines and draws them more precisely than doing it by hand, saving time and ensuring accuracy.
Moreover, TrendSpider’s algorithm makes decisions using data sets and facts trading stocks, removing bias and emotion from the trading equation. The platform offers a strategy backtesting framework on timeframes ranging from 1-minute to monthly charts, enabling traders to test and optimize their strategies.
Additionally, TrendSpider’s Multi Symbol view allows users to visualize up to 16 different charts on one page, making it easier to compare and analyze multiple stocks at once. The platform’s customization options and advanced charting functionalities provide traders with a comprehensive tool to support their trading strategies, making it an ideal choice for smart investors.
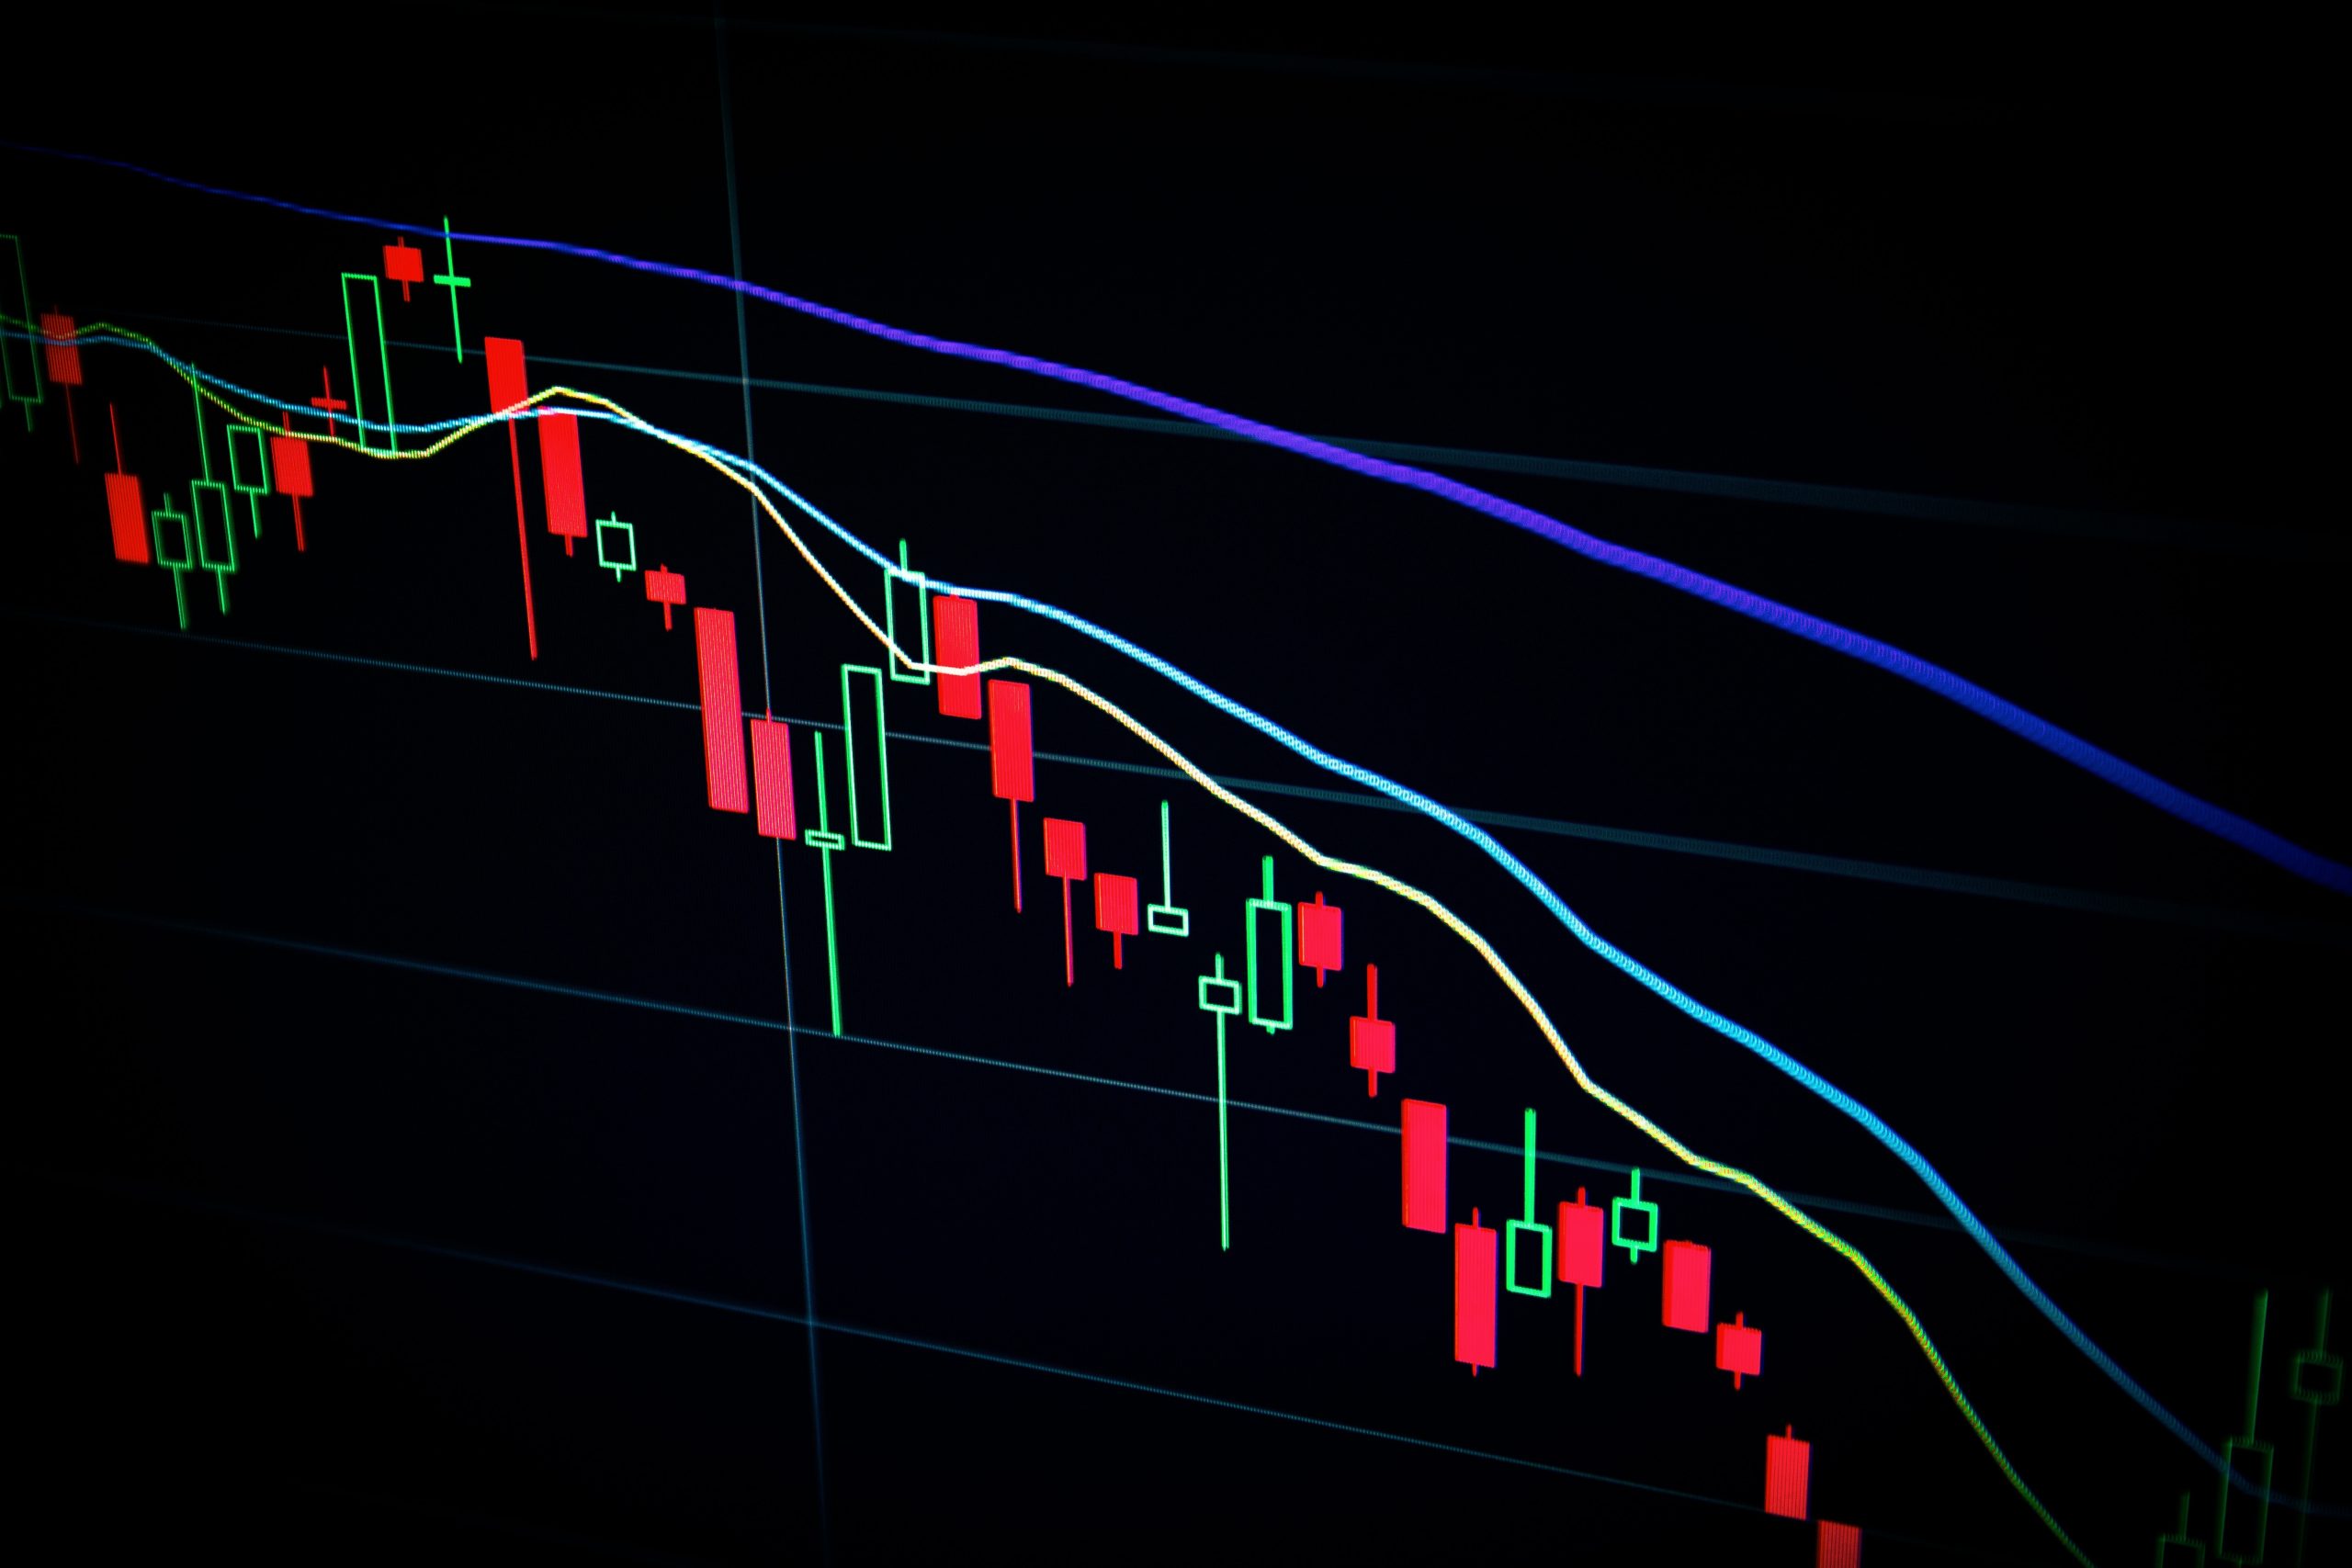
Candlestick Pattern Recognition
Candlestick pattern recognition is a crucial feature for traders who want to identify potential trend reversals and make informed investment decisions based on objective data. By analyzing candlestick patterns, traders can gain insight into the market sentiment and gauge the strength of supply and demand. The visual representation of price movements in candlestick charts allows traders to spot patterns and trends quickly and make informed trading decisions. However, some traders argue that relying solely on candlestick patterns may not be sufficient for successful trading strategies. It is essential to combine candlestick pattern trading strategies with other technical indicators and fundamental analysis to make informed trading decisions.
Table: Benefits of Using Candlestick Patterns in Trading
| Benefits | Description |
|---|---|
| Easy to Read | Candlestick charts provide a visual representation of price movements, making it easy for traders to spot patterns and trends. |
| Objective Data | The use of candlestick patterns provides traders with objective data that can be used to make informed trading decisions. |
| Market Sentiment | Candlestick patterns can reveal the market sentiment and gauge the strength of supply and demand. |
| Trend Reversals | By analyzing candlestick patterns, traders can identify potential trend reversals and take appropriate actions. |
Candlestick pattern recognition is an essential feature for traders who want to make informed trading decisions. While it may not be sufficient to rely solely on candlestick patterns, combining them with other technical indicators and fundamental analysis can help traders develop successful trading strategies. By using candlestick patterns, traders can gain insight into the market sentiment, gauge the strength of supply and demand, and identify potential trend reversals.
Multi-Timeframe Analysis
Moving on from the previous subtopic of Candlestick Pattern Recognition, let us now delve into the Benefits of Multi-Timeframe Analysis in TrendSpider.
Multi-Timeframe Analysis is a powerful tool that allows traders to make better trading decisions by analyzing price action across different timeframes. With TrendSpider’s Multi-Timeframe Analysis feature, users can overlay trendlines, indicator values, and candlestick patterns from other timeframes onto their current chart, giving them a broader perspective on the market.
This feature is particularly useful for swing traders and investors who want to identify long-term trends while still being able to make short-term trades. By analyzing multiple timeframes, traders can gain a better understanding of the market’s overall direction and make more informed decisions about when to enter or exit a trade.
Overall, Multi-Timeframe Analysis is a valuable tool that can help traders stay ahead of the curve and make more profitable trades.
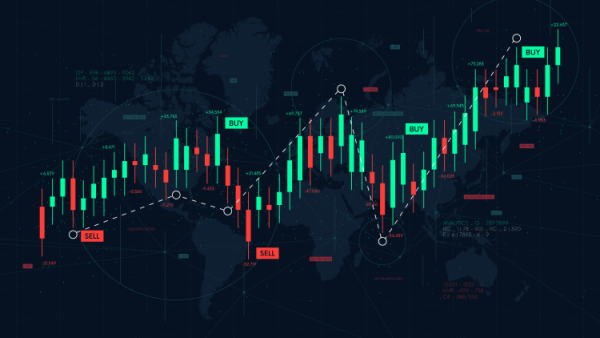
Smart Alerts and Watchlists
The Smart Alerts and Watchlists feature offered by the stock analysis software allows for customizable and dynamic notifications, providing traders with timely updates on market changes and potential trading opportunities. With automated notifications, traders can stay on top of their investments and react quickly to changes in the market.
Customizable filters allow traders to tailor their alerts based on specific criteria, such as stock price movements, volume, and technical indicators. TrendSpider’s watchlists provide a centralized location for traders to track their favorite stocks and monitor market trends.
With customizable filters, traders can easily sort and prioritize their watchlists based on specific criteria, such as stock price movements, volume, and technical indicators. This allows traders to quickly identify potential trading opportunities and stay on top of market trends.
Overall, the Smart Alerts and Watchlists feature is a powerful tool for traders looking to stay informed, react quickly to market changes, and maximize their investment opportunities.
Options Flow
Moving on from TrendSpider’s Smart Alerts and Watchlists, the platform also offers an Options Flow feature for traders interested in options trading strategies. This feature tracks unusual options activity, including large directional options trades like block trades and options sweeps.
With this tool, traders can measure trade size, expiration date, strike price, and visualize results within a widget. Options Flow is a valuable tool for traders looking to gain insight into market sentiment through unusual options activity.
The feature allows traders to identify potential opportunities and make informed decisions based on data-driven analysis. With TrendSpider’s Options Flow, traders can stay ahead of the game and make more strategic trades.
Heatmap
Visualizing current and historical order book support and resistance levels, the Heatmap feature of TrendSpider’s stock analysis software provides traders with real-time visualization of potential market opportunities.
The Heatmap uses color-coding to provide detailed information, making it a valuable tool for identifying possible market trends.
The Heatmap feature is particularly useful for traders looking to make informed decisions based on current market conditions.
The following are some of the benefits of using the Heatmap feature on TrendSpider’s stock analysis software:
- Real-time visualization of order book analysis
- Detailed information provided through color-coding
- Helps identify potential market opportunities
- Enhances decision-making based on current market conditions
- Useful for traders looking to make informed decisions based on real-time data
Strategy Backtesting
One valuable feature of the stock analysis software is the ability to test trading strategies on multiple timeframes, allowing traders to evaluate the effectiveness of their approach in different market conditions. TrendSpider offers a comprehensive strategy backtesting framework on timeframes ranging from 1-minute to monthly charts. The backtesting feature can be used to test all kinds of trading strategies and analyze their performance over time.
TrendSpider’s backtesting tool is fully automated, allowing traders to quickly test their theories and strategies. The results of the backtesting are presented in a clear and concise way, making it easy for traders to identify patterns and trends. The backtesting tool includes a range of performance metrics, including win/loss ratios, profit/loss ratios, and maximum drawdown. These metrics are presented in a table format, making it easy for traders to compare the performance of different strategies. The table below summarizes some of the key features of TrendSpider’s backtesting tool.
| Feature | Description |
|---|---|
| Automated testing | TrendSpider’s backtesting tool is fully automated, allowing traders to quickly test their theories and strategies. |
| Multiple timeframes | The tool allows traders to test their strategies on a range of timeframes from 1-minute to monthly charts. |
| Performance metrics | TrendSpider’s backtesting tool includes a range of performance metrics, including win/loss ratios, profit/loss ratios, and maximum drawdown. |
| Clear presentation | The results of the backtesting are presented in a clear and concise way, making it easy for traders to identify patterns and trends. |
Customizable Interface
The customizable interface of the TrendSpider stock analysis software provides traders with design options that cater to their individual preferences and needs. Users have the ability to customize their charts based on their trading style, whether it be day trading, swing trading, or investing. The interface allows for the customization of indicators, chart types, and color schemes, among other features.
The software’s customizable interface also includes the ability to set up smart alerts that notify users of market changes and potential trading opportunities. Traders can set up alerts based on their preferred technical indicators, trend lines, and support and resistance levels. By customizing the interface and alerts, traders can streamline their trading process and focus on the aspects of the market that matter most to them.
Pricing and Discounts
Moving on from the previous subtopic of customizable interface, we now delve into the pricing and discounts offered by TrendSpider. The software offers three subscription plans: Premium, Elite, and Advanced, with prices ranging from $39 to $129 per month. Each plan includes different features such as multi-timeframe analysis, candlestick pattern recognition, and automated alerts.
For those who want to save on costs, TrendSpider offers a 16% discount on its yearly subscription plans. Additionally, they offer promotional offers such as a 7-day trial and a 15% discount using the code DAY15. Yearly subscribers can also take advantage of the savings from the yearly plan, which is 16% cheaper than the monthly subscription plans. Active traders can even reduce the cost to as low as $28.05 per month.
With these pricing and discount options, TrendSpider aims to provide a cost-effective solution for traders who want real-time data and alerts within a modern trading tool.
Frequently Asked Questions
Does TrendSpider offer any social trading features or allow users to follow other traders?
There is no evidence to suggest that TrendSpider offers social trading features or allows users to follow other traders. However, social trading benefits are well-established and include the ability to learn from successful traders, access to a diverse range of trading strategies, and the potential for increased profits.
Following successful traders can also provide a sense of community and support, as well as a way to stay up-to-date with market trends. While TrendSpider offers a range of technical analysis tools and automated features, it does not appear to have a social trading component at this time.
Can TrendSpider be used for paper trading or simulation trading?
TrendSpider allows users to practice their trading strategies without risking real money through paper trading or simulation trading.
Paper trading benefits include learning how to manage risk, developing and testing new strategies, and gaining confidence in executing trades.
Simulation trading strategies involve using software to simulate real market conditions and test trading strategies. This feature allows users to test their strategies under different market conditions, analyze their performance, and refine their approaches based on the results.
By using paper or simulation trading, traders can improve their skills and develop a profitable trading system before committing real capital to the market.
Does TrendSpider offer any fundamental analysis tools or data?
Fundamental analysis integration is not currently available on TrendSpider. The platform focuses on technical analysis and provides automated charting features, customizable alerts, and multi-time frame analysis. While TrendSpider offers a variety of advanced technical analysis tools and data sources for subtopics such as candlestick pattern recognition, automated Fibonacci retracements, and real-time prices for U.S. stocks, forex, and cryptos, it does not offer any fundamental analysis tools or data.
However, the platform provides a robust backtesting framework on timeframes ranging from 1-minute to monthly charts and an Options Flow feature for tracking unusual options flow, including large directional options trades like block trades and options sweeps.
Is there a mobile app available for TrendSpider?
Mobile app availability is an important factor for traders who desire the flexibility to monitor their investments on the go. Unfortunately, TrendSpider does not currently offer a mobile app for its users.
This means that individuals who prefer to use their mobile devices for trading will need to access the platform through their web browser. While this may not be ideal for some users, it is important to note that TrendSpider’s web platform is highly customizable and provides a user-friendly experience.
Despite the lack of a mobile app, TrendSpider’s comprehensive suite of features and advanced technical analysis tools make it a popular choice among traders who prioritize precision and accuracy in their investment decisions.
Does TrendSpider offer any educational resources or courses for traders?
TrendSpider offers a range of online courses and trading resources for traders looking to improve their skills. These resources include video tutorials, in-depth blog posts, and webinars on various trading topics.
The platform also provides access to a community of traders, where users can discuss trading strategies and get feedback from other members.
Additionally, TrendSpider offers a range of customizable tools and features to help traders analyze the market and make informed trading decisions. These features include automated technical analysis, trendline analysis, chart patterns recognition, candlestick pattern recognition, and real-time price alerts.
Overall, TrendSpider provides a comprehensive platform for traders looking to enhance their trading skills and stay up-to-date with the latest market trends.
Conclusion
In conclusion, TrendSpider is the ultimate trading tool for smart investors. With its innovative and customizable products, it takes emotion out of the trading equation and serves thousands of registered members.
Its advanced charting functionalities, candlestick pattern recognition, and heatmap features provide valuable insights to traders, and its automated technical analysis and strategy backtesting tools enable traders to make informed decisions.
Furthermore, TrendSpider’s customizable interface and real-time prices for U.S. stocks, forex, and cryptos make it a versatile platform for day trading, swing trading, and investing. With its competitive pricing and discounts, TrendSpider is a cost-effective solution for traders looking to enhance their trading strategies.
Overall, TrendSpider is a comprehensive and reliable trading tool that can help traders achieve their financial goals.